End-User Monitoring with Alyvix
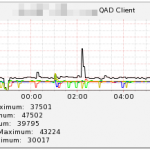
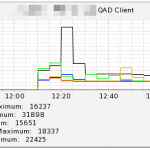
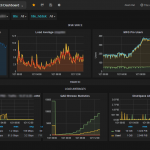
Ever heard of Alyvix ? That’s a free environment for monitoring application performance by emulating an end-user interacting with the real application. I’ve created a monitoring agent for the QAD/ERP software that allows one to measure the login time as well as the performance of different programs and queries throughout the day from an end-user perspektive. The data can be retrieved from the Monitoring workstation using a REST gateway in order to be displayed within Cacti.
Look at the attached graphs for the result:
CereusReporting Version 3.0 has been released
Version 3.0 has been released. The new version can be downloaded from the product download page. Please note that the new version requires a new license file for the commercial product. Please contact support prior to upgrading to this version.
CereusReporting Version 3.0 – Beta Release
The Beta version of CereusReporting Version 3.0 Standard Edition has been released. The new version includes an improved user interface as well as multiple enhancements for the Personal, Professional and Business Editions. Regular Expressions based Graph and Host selection as well as Tree-Based item selections have been added and the user interface has been improved for easier Report generation. Look here for more information
HowTo – Setup InfluxDB Datasource in Grafana
New HowTo for installing Grafana on CentOs 7 available !
There’s a new HowTo available for installing Grafana on a CentOs 7 system. You can use that along with the influxdb howto to get a target system up and running to be used with the CereusTransporter plugin. Follow this link for more details: HowTo Install Grafana on CentOs 7
CereusReporting Personal available
A new CereusReporting Personal edition of CereusReporting for Home users is now available. It has the full features of the Professional edition (limited to 1 server) and can be used for non-commercial use.
Look here for more information:
Monitor Linux Server with Cacti – Part 1
In this little HowTo series “Monitor Linux Server with Cacti” we are going to look into configuring a Linux server to be monitored by Cacti and how to create the graphs within Cacti itself.
New online shop available
We’re proud to announce the availability of our new online-shop integrated right into this website. The new shop allows you to select the products and services you need and get an immediate overview of the attached costs. While there are currently only a few products available, we are planning to more during the coming weeks.
Visit the new shop here: Online Shop

