CereusTransporter 1.0 has been released!
Exciting news for all Cacti users!
I am thrilled to announce the release of the CereusTransporter 1.0 plugin for Cacti. This powerful plugin lets you easily send data from Cacti to InfluxDB2 for advanced monitoring and analysis.
With CereusTransporter, you can easily monitor and analyze data from multiple sources in near real-time, giving you a complete picture of your network performance.
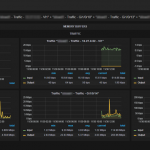
Built Dashboards in Grafana, or use Machine Language to identify issues before they occur.
If you need support or have any questions about the CereusTransporter plugin, please contact us.
Download the plugin today and take your network monitoring to the next level!
Installing InfluxDB on CentOS 7
A new InfluxDB on CentOS HowTo has been created, describing the installation steps required to get a new influxdb instance running on a CentOS 7 based system.
Visualizing Cacti Data with Grafana and InfluxDB
Introduction
Cacti has a great polling engine for retrieving SNMP, WMI and other data from a lot of different devices. It generally stores the data into RRD files which are then being used to create the actual graphs for the users to view. By using InfluxDB together with Grafana as a frontend, it is possible to built an easy to use performent dashboard for end-users utilizing the Cacti polling engine.


